Introduction to Technical Analysis
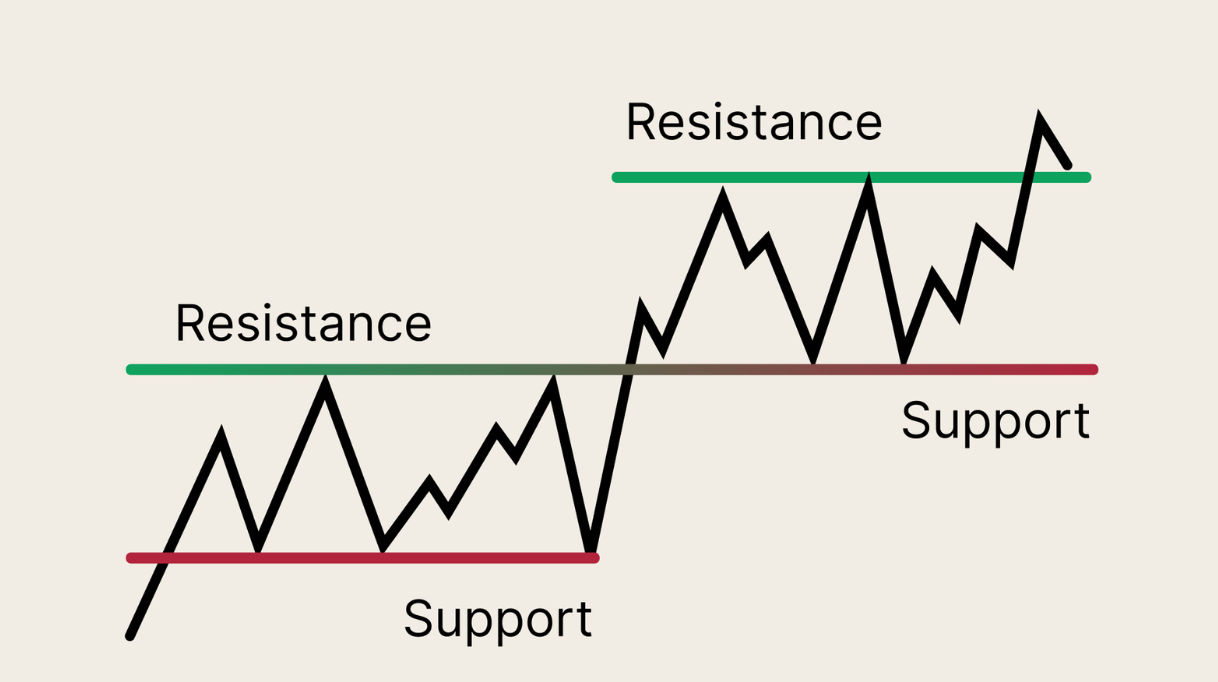
Support and resistance lines tend to be horizontal and can be used across different timeframes. These can develop into Major and Minor support and resistance lines. A Major line can span months/years, whilst minor lines may be days/weeks.
Support Lines:
Think of support as a trampoline. When an asset's price falls to a certain low point, it tends to bounce up. This happens because buyers see value at this price and buy the asset, increasing demand and stopping the fall.
Resistance Lines:
Think of resistance as a ceiling. When an asset's price rises to a certain high point, it tends to fall back down. This happens because sellers believe the asset is too expensive and sell their holdings, creating a supply of assets that stops the price from rising further.
Trend lines:
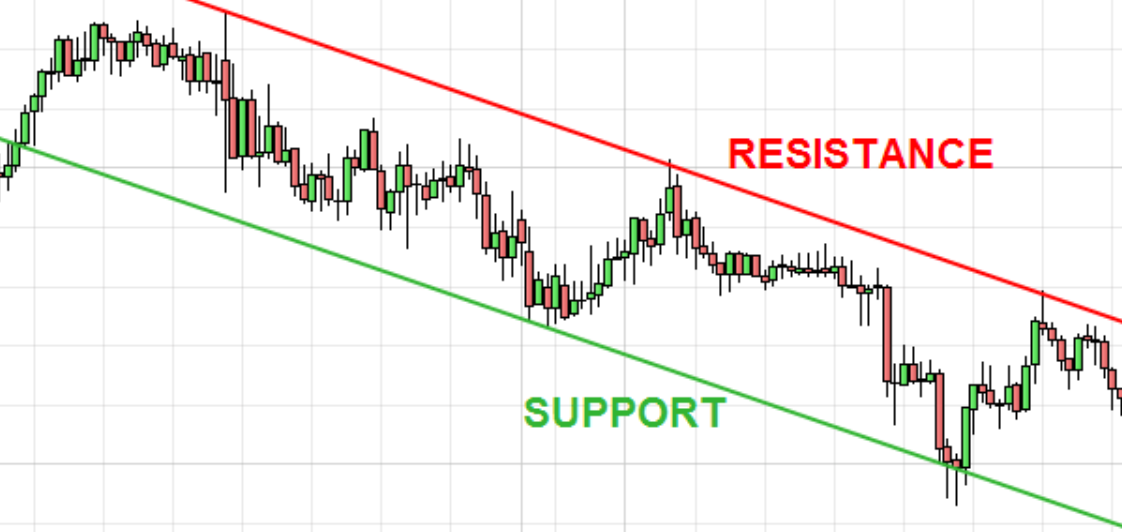
Trend lines are dynamic angled lines used to track assets that are trending up or down over time, and can be used across different time frames. These too can develop into Major and Minor trend lines. A Major trend line can span months/years, whilst minor trend lines may be days/weeks.
In addition, Trend lines can also act as Support and Resistance lines.
Moving Average (MA) and Exponential Moving Averages (EMA):
A Moving Average is as it sounds. It’s a calculation of the average price at the end of the trading period. The trading period may be any period of time, e.g. mins, hours, days, weeks, months etc.
The MA is a tool that smooths price data by creating a constantly updated average price, and therefore helps to reduce the “noise” of the price movement of the asset throughout your chosen time period.
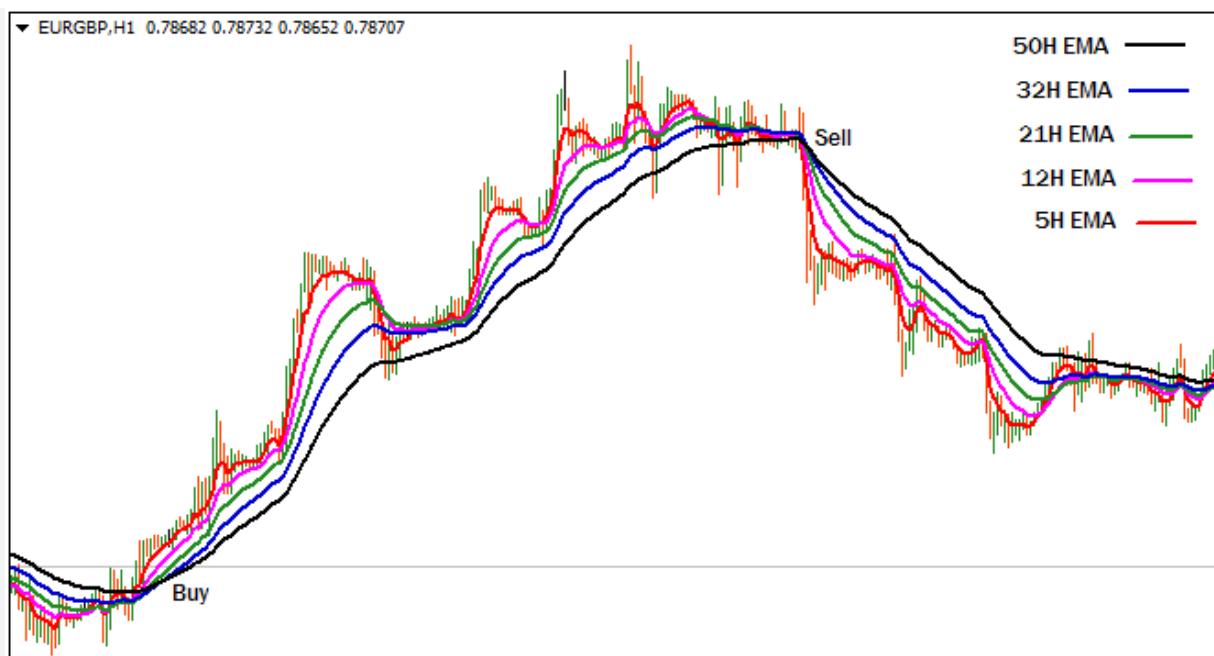
Unlike a MA, the Exponential Moving Average gives more weight to the most recent prices. This makes the EMA line react faster to new market changes.
I only use EMAs and this is a very basic intro to MAs and EMAs. There’s lots of sites and uTube videos that fully explain MAs and EMAs as well as discussing the actual mathematical calculations.
I use EMAs as a form of dynamic support and resistance lines to help with my day trading. Though these can also be used for long term investing too.
Chart Patterns:
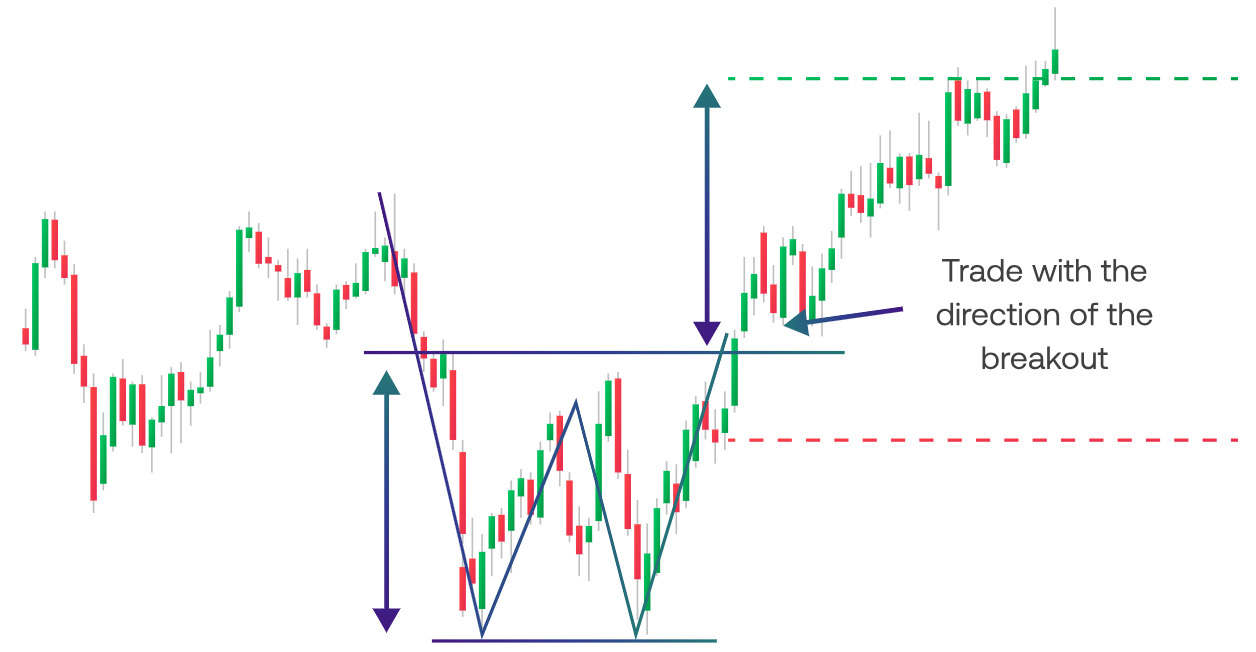
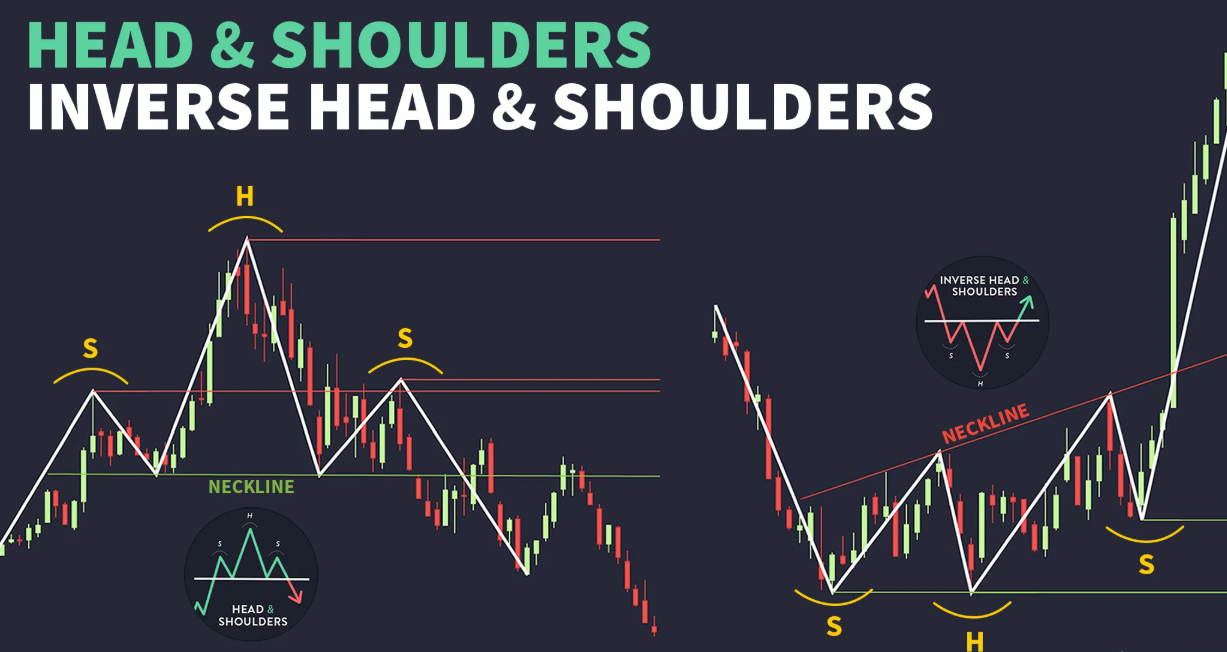
A chart pattern is a visual shape on a financial price graph that helps predict future market movements. These patterns form because human trading behavior tends to repeat. When buyers and sellers fight for control, their actions create recognizable shapes like triangles, wedges, and peaks.
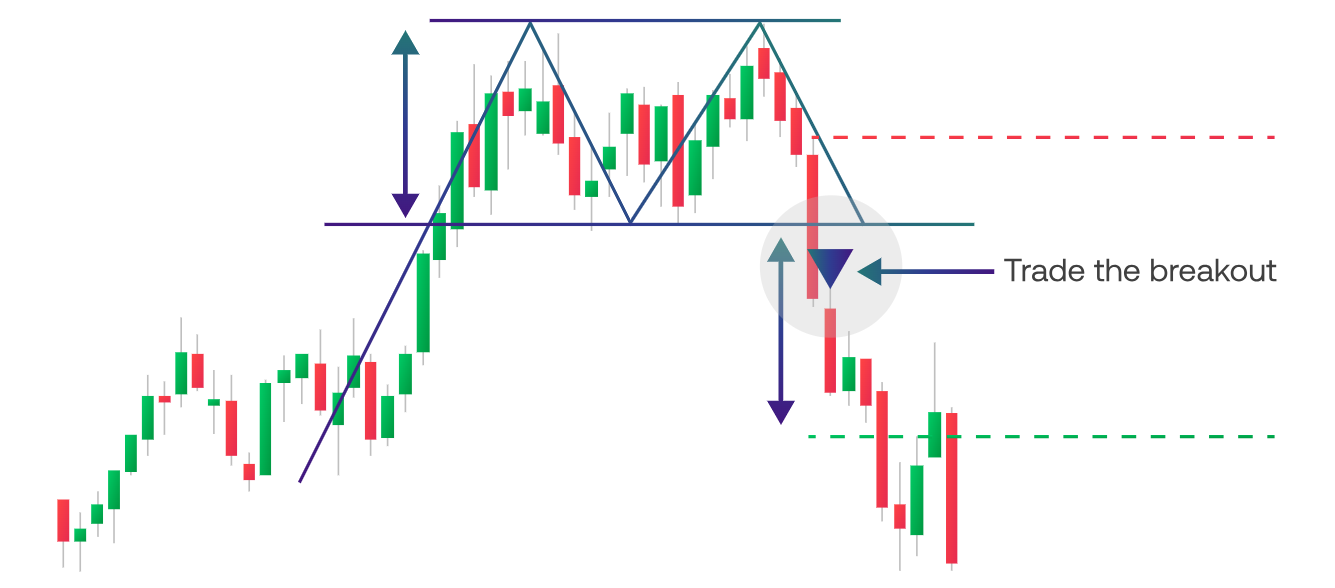
There are many many chart patterns, however I tend to look for Reversal Patterns, such as
Double Tops/Bottoms
Triple Tops/Bottoms
Head and Shoulders
These will be discussed in greater detail on subsequent pages (to be added) or on 1-2-1 coaching calls.