Basic Principles/Understanding
Some Terminology
Bid (Buy) Price - The highest price a buyer is willing to pay for an asset
Offer (Sell) Price - The lowest price a seller is willing to accept for an asset
Spread - The difference between the Bid and Offer price, sometimes referred to as the commission
Liquidity - How easily an asset can be bought or sold without impacting its price
Volatility - The speed and magnitude of price movements in a given market
Volume - The total number of shares, contracts, or units of an asset that are bought and sold during a specific time period
Technical Analysis vs Fundamental Analysis
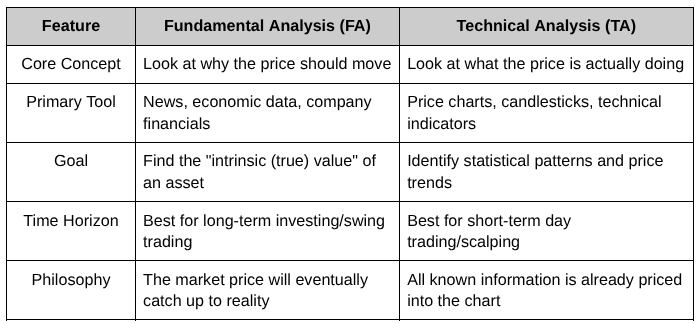
The core difference between fundamental and technical analysis is what data you look at to make a trading decision.
Fundamental analysis studies the cause of price movements (the economic health of an asset), while Technical analysis studies the effect (the actual price movement on a chart).
What is Fundamental Analysis (FA)?
Fundamental analysis is the method of evaluating an asset by measuring its intrinsic value. You look at everything from the overall economy to specific industry conditions and the management of a company.
Typically:
For Stocks & Shares: You examine company balance sheets, revenue, debt, profit margins, and earnings reports.
For Forex: You track Central Bank interest rate decisions, employment figures, Gross Domestic Product (GDP), and inflation data.
For Crypto: You look at network transaction volumes, active wallet addresses, developer activity, and upcoming protocol upgrades.
Basic (very simplistic) Trading Rule: If your analysis shows an asset is worth more than its current market price, you buy. If it is worth less, you sell.
What is Technical Analysis (TA)?
Technical analysis is the framework traders use to study price movement. It relies entirely on charts because technical analysts believe that all fundamental data, news, and market psychology are already reflected in the current market price.
Main points to consider:
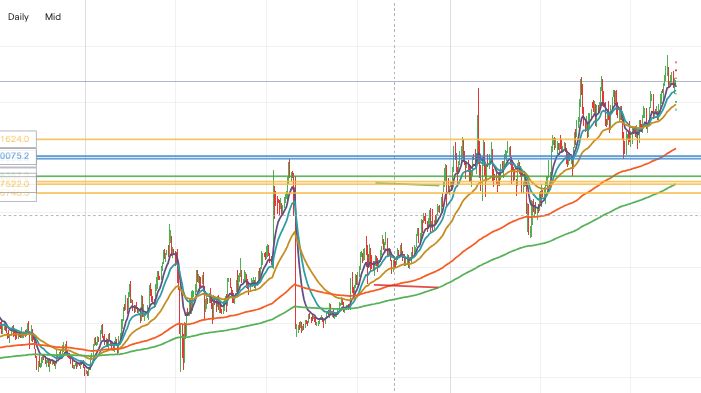
Key Tools: Candlestick patterns, support and resistance lines, moving averages, and volume indicators
Pattern Recognition: TA assumes that human psychology drives markets, and because human behavior doesn't change, chart patterns repeat themselves over time
Trend Following: Traders look to see if the market is making higher highs (uptrend) or lower lows (downtrend) to ride the momentum
The Trading Rule: You do not care why a company is doing well; you only trade the high-probability patterns appearing on the screen right now
Technical vs Fundamental Analysis
Real-World Example: Evaluating Apple (AAPL)
The Fundamental Analyst looks at Apple's quarterly iPhone sales, its cash reserves, global supply chain costs, and upcoming AI features. They conclude that Apple's business is undervalued at $200 a share, so they buy it to hold for 6 months.
The Technical Analyst ignores the iPhone sales completely. They look at Apple's 1-hour chart and see the price has bounced off a "support line" three times and a "bullish engulfing candlestick" has formed. They buy at $200 with a plan to sell it at $205 by the end of the day.
Very different styles with very different outcomes.
I am typically a day-trader and use Technical Analysis only.